5 min read
Getting Started with AutoML: Feature Engineering

Who wouldn't want to predict the future? With Qlik AutoML, you can easily create predictive models based on your data. As the name of the feature suggests, Qlik AutoML automates a large part of this process for you. Even so, as a user you still have a lot of influence over the effectiveness of the predictive model. In the blog series "Getting started with AutoML," we explain what you can do to make your predictive models with AutoML even better, and how you can integrate the results into your existing Qlik dashboards.
What Is Feature Engineering
In this first part of the blog, we look at "feature engineering." Feature engineering is the process in which you use domain knowledge to adjust your dataset so it can be used as effectively as possible for prediction.
Fortunately, there are already a number of steps in this process that AutoML can do for you. You'll notice this as soon as you load a dataset into your AutoML experiment. See, for example, the image below:
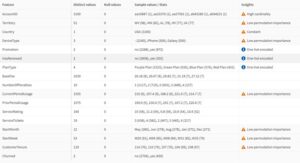
In the 'Insights' column you can see that Qlik AutoML applies "One-hot encoding" to our columns with fewer than 14 possible values. For columns with 14 or more possible values, Qlik uses "Impact encoding." These encoding techniques are a requirement for many machine learning models to properly handle this type of information.
Another processing step Qlik automatically performs for you is "Null imputation." This means Qlik fills in fields where (less than 50% of the) values are missing, for example by taking the average of the remaining values and filling that into the empty spots. Qlik itself chooses which method is used to perform this imputation.
Finally, Qlik will also automatically scale and normalize values. This means that for numerical values, it calculates the mean and standard deviation and then normalizes the column based on the number of standard deviations from the mean.
Adjusting Your Dataset Yourself
Although Qlik does a lot of the work for you, there are also steps you can take yourself to prepare your data even better for the machine learning model. Qlik isn't able to implement these optimizations itself because they require context and real-world knowledge. We'll cover 3 common techniques:
1. Categorizing
Imagine this: we work in the flower industry and want to build a predictive model for the number of roses we sell. In our historical data we have a number of properties, including, per date, the number of roses of a certain color and size sold.
We could throw this dataset directly into AutoML, but we know that roses sell more on specific days, such as around Mother's Day and Valentine's Day. We can incorporate this knowledge into our dataset. The simplest way is to create a flag for special days:
| Date | IsHoliday |
| 12-02-2025 | 0 |
| 13-02-2025 | 0 |
| 14-02-2025 | 1 |
| 15-02-2025 | 0 |
This way, our model knows which days are holidays and can factor this into the model. If we think about it a bit longer, we know that in the days before and after such a holiday, extra roses are often sold too, since not everyone gives roses on the day itself. We could then, for example, introduce 2 columns:
| Date | DaysUntilHoliday | DaysSinceHoliday |
| 12-02-2025 | 2 | 42 |
| 13-02-2025 | 1 | 43 |
| 14-02-2025 | 0 | 0 |
| 15-02-2025 | 86 | 1 |
2. Discretizing and grouping
Some fields in your dataset have a huge number of different values — think, for example, of a column with ages, where in theory all sorts of values between 0 and 100 occur. However, the exact age is often not relevant to the value you want to predict. It doesn't make much difference whether someone is 32 or 35 years old. It might make a difference whether someone is 16 or 85. To solve this, you can transform the age column into age groups:
| Age | Age group |
| 0-12 | Child |
| 12-17 | Teenager |
| 18-25 | Young adult |
| 25-65 | Adult |
| 65+ | Senior |
Of course, the groups can differ depending on the type of data you're working with — that's exactly where you add your expertise.
3. Splitting properties
Sometimes columns in your dataset secretly contain multiple pieces of information. A classic example of this is date and time. A column combining date and time often has little predictive value because there are so many different values that they're nearly unique per row.
You can solve this by splitting the field into separate date and time fields. From the date field you could calculate the season or quarter, and the time field could be simplified further into hour and minutes. Of course, you can also combine this with grouping as described above, for example by splitting the time into morning, afternoon, evening, and night.
Conclusion
As you can see, there are many different ways you can manipulate your data before loading it into AutoML. This is often an iterative process: you adjust the data, have AutoML train a model, and then check whether the new features are important to the model. You can read how to see which features are important in your model, and how to assess whether your model is successful, in our next blog in this series, so stay tuned!

Written by Lennaert van den Brink
Cluster Manager/Senior BI Consultant